Wednesday, March 12, 2014

Aerial Imaging Equipment Introduction

Introduction

The class took the opportunity from the much improved weather conditions to go outside and test some of the ways of gathering field data we had discussed in the unmanned aerial system mission planning assignment and throughout class . It was simply to see some of the ideas put in to basic practice.

We tested 3 methods of collecting aerial data unmanned with 4 different equipment types. With no specific project set or in mind, other than to capture some images from above where we were, there were no specified attributes to be analysed.

Study Area

We needed an area, that would be fairly clear of people and buildings in order not to invade people's privacy and to have the are beneath clear of people in case the instruments should fall. We used the green area outside Eau Claire's indoor sport's centre and soccer park, as shown in figure 1. It is a flat area covered in grass, with the areas of tarmac for the car park.

Figure 1: Green space in Eau Claire's soccer park used for our aerial imaging. 


Methods

The first method we looked at was unmanned aerial vehicles, where we tested two different types of  remote control rotor copters. Each had on board cameras and GPS devices as well as the operational circuit boards. One had three large  "legs" (figure 2) and another with  smaller "legs"(figure 3). The first one was its first launch, and so when it was flown it was slightly less stable as it calibrated to where it was (figure 4).  The second had been flown many times and so was more stable and was able to get more where it was directed.

Figure 2: The first rotor copter that was used to capture aerial images in the field. 

Figure 3: The second rotor copter that was used to gather aerial images whilst in the field. 

Figure 4: The slightly less stable first rotor copter calibrating on it's first flight. 

We also tried a more basic method of a kite, we assembled the kite (figure 5) then attached the belay device and cast it until it was at about 100 feet (figure 6). A camera was then attached to a form of hamper device and attached to the kite string, and then the kite was cast higher in order for the camera to become high enough to take images. (figure7)

Figure 5: Assembling our kite before flying it to gather data from the air.

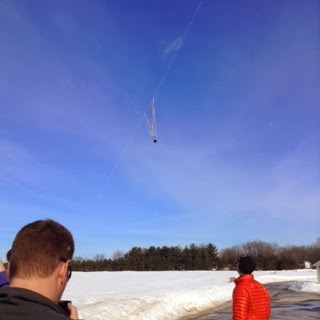
Figure 6: The camera once attached to the kite string being sent up in to the air. 

Figure 7: The kite and attached camera high up during data collection. 

The third method we tried was using a rocket with two micro cameras attached to the side. These were very small lightweight cameras as was the rocket, and so were attached to the sides of the craft with industrial tape (figure 8). The rocket was electrically powered and so had a fuse device to set it off with. (figure 9)


Figure 8: Attaching the small cameras to the sides of the rocket. 

Figure 9: The rocket we were using in the field before setting it off, the wire can be seen which lead to the control button. 

Discussion

The rotor copters were by far the most technical advanced, and as such could cover a much wider are much faster, both made use of the emergency device in which the on board G.P.S. unit will direct it back to it's starting position on the ground should control be lost, which I felt was a really good design feature. It also had a device on it that made sure the camera was always in the same steady and stable position which is useful in being able to get high quality comparable images.


If money was an issue in a project or technology, as it so often does fails, then the kite it is a good alternative method. However, it does require the right conditions to be able to fly, and it was relatively quick to set up and deploy.

The rocket launch did not work particularly well for us, and we have yet to see if the cameras were able to catch any stable images which is questionable given the speed of the device.

The results of the photos fro the kite worked well. As it was not positioned extremely high up and we did not walk around with it, only the area directly above us and a little bit around us was covered, but the quality of the picture is good. One of the best images from the days can be seen below in figure10, where the snow covered playing fields, the outbuilding and our group can be seen.

Figure 10: Aerial image taken with the sue of a kite of the area directly above the class.


Conclusion

It was really good to be able to go out in to the field and put in to practice some of the methods that we had spent to long talking about and researching and learning,a little about the technologies and the processes that go in to actually using them. It is good to have a variety of different methods to use in case one does not work, or the project does not dictate that such advanced technology is necessary.


Sunday, March 9, 2014

Microclimate Geodatabase Creation for Deployment to ArcPad

Introduction

Data collection in the field should be as efficient as possible in order to make the most of time and money, and still achieve an accurate and satisfactory result. So creating a geodatabase in ArcMap with the fields you will be studying, allows you to out the information you collect straight in to an organised and workable format.

This task was preparing us for some fieldwork data collection we would be doing in order to make a micro climate map of the University of Wisconsin-Eau Claire campus. For us to collect the various datum about the climate we had to create a geodatabase in ArcMap, with feature classes withing that geodatabase that would relate to the various climatic factors we would be measuring. Appropriate domains fo each feature set needed to be stated also.

Methods

When creating a geodatabase for use in the field it is important to consider that there will more than likely be various different attributes  included in the data, each with their own characteristics and unit of measurement. So, one must set pre-defined domains to each different attribute in order to make sure that the data is recorded in a way specified by an employer or project leader and will be within a format that is applicable to that type of data and so can be related to other features.

It also means that results and datum are more easily adjusted, and can be compared with each other and trends noticed and queried whilst in the field. You want the geodatabase to be as easy to use as possible for as many different users as possible s fieldwork can be carried out in groups and data added to the same standards as each other. It allows fieldwork to be undertaken more quickly also. Other users of the ESRI products may also be able to use the data in a way they can understand and edit and add to.

For a climate map such as the one we were to be creating for this geodatabase's use, the attributes that can be recorded include; temperature, wind speed, wind direction, dew point, the relative humidity, snow depth, the time of the data collection as well as any notes on the data that are felt appropriate. Attributed can contain domains with short or whole integers, or float integers. Short and long domains are used for datum whose values contain whole numbers, and float integers are used when those values contain decimal figures.

In order to create our geodatabases  we used the ArcCatalog program, where we directed through the University server to make a folder connection to our own personal class folders. Right clicking on this folder and hovering the cursor over "New..." in the drop down menu, and then selecting "New File Geodatabase", allowed us to create a blank geodatabase.

Clicking twice on this un-named geodatabse slowly, meant we could change the name to something more appropriate e.g. Campus Microclimate. Right clicking on this newly named geodatabase and selecting "Properties..." from the bottom of the drop down menu, opened up the properties window. We then clicked on the "Domain" tab at the top. Here we could add the features we wanted to the table in the window and set the appropriate domains for each.

Clicking on an empty cell in the first column allows you to add a title for a feature, this was repeated for all the desired features. In the second column a description can be given once necessary. When a row is highlighted a second table appears below, and can be used to set the domains. The integer type can be chosen from the drop down menu in the first row, and where a range is necessary for the value this can be typed in to the cell next to the "Range" cell.

For use with the Juno the devices we will be using during our fieldwork a new feature class had to be created. This is done by going back to the "New" option this time in the named database menu and feature class clicked on. Opening the properties of this feature class enabled us to set up the fields in the table in the "Fields" tab, the field was typed in to the rows again and the domains added.

A raster hat had been previously created for the class was imported in tot the geodatabase by right clicking to get the drop down menu, hovering over 'Import...", then selecting the raster file from a folder. Both the feature class and the raster we added to a new map in ArcMap, by dragging them over from ArcCatalgoue, atnd this map was saved ready to input the data post fieldwork.

Conclusions

Creating geodatabses and map documents prior to carrying out fieldwork, can then enable data to be inputted straight to the geodatabse with the use if a handheld digital fieldwork device. Making both the data collection and analysis afterwords more efficient. Data sets can have many different features that require domains to be preset to assure accuracy.