This assignment was aimed at getting us thinking about the
re-planning and preparation that goes in to any type of field work, and
especially where very high tech expensive equipment is used. As, any time lost
in the field due to lack or preparedness, or failure to assess if the
conditions are suitable, can waste significant amounts of money.
In thinking about the Geographical world today and many of
the data collection that is carried out, some astonishing technological
advances have been made. Data can be collected, quicker, more often, to a
higher standard, with less people, and different data types can be collected.
Much of it involves out sourcing to other professions that have a better
understanding of the data collection. But these professionals can sometimes
have a lack of understanding for the sort o f geospatial thinking that is
required by geographers to carry out fieldwork.
In this assignment we were given 5 scenarios in which
companies may require unmanned air vehicles in order to collect data in aspects
of geographical phenomenon. We had to think about the different things we would
have to survey, how we would do that, the inputs that would be needed from
technology to a sampling method. In order to come up with some ideas that a
company could use in these situations.
Scenario1:
-
A pineapple plantation has about 8000 acres,
and they want you to give them an idea of where they have vegetation that is
not healthy, as well as help them out with when might be a good time to
harvest.
Firstly,
the area is fairly large so if the methods we come up with prove to be too time
consuming or expensive, a sampling
method could always be employed in order to get a general idea of the
vegetation on the land.
Also,
we thought that maybe the type of data that we would be collecting could maybe
be used over several seasons, so may prove to be worth the money and time. We
thought that once it had been highlighted which areas had the pooper quality
vegetation, and which area was best to harvest then, these trends might apply
across a few growing seasons.
I
order to highlight the areas where the vegetation is less health than others,
we felt that a near infrared sensor
could be used. Near infrared sensors detect electromagnetic waves of
wavelength 3.5 to 20 micrometers, as this is the wavelength of moisture particles.
As water is one of the input elements of the process of photosynthesis, we thought that areas where we could detect higher
moisture levels would be areas where the vegetation would be healthier. Figure
1 below shows an example of this type of sensor being put in to practice in
relation to vegetation health. You can see how it clearly shows the different
areas of soil health, and how you could determine which areas were less
healthy.

Figure
1: An example of a near infrared sensor image being used to measure the
health of vegetation in Colorado. (© Federation of American Scientists)
However
it must be taken in to consideration that these sensors can be expensive, and
they must be kept very cold when used, as the radiation that is being sensed is
so weak. In order to acquire knowledge on areas where the plants are ready to
harvest, we thought perhaps a digital camera
could be used in order to see the colours of the landscape and wee where
the crop is ripe enough to pick. This would be a fairly cheaper part of data
collection as cameras are cheaper than remote sensors, but it would have to be
a high resolution camera, in order to detect the image from a significant
height above the fields.
These
sensors would then have to be attached to an unmanned aerial system, in
order to acquire the data from above and keep costs to a minimum. We would
recommend using an Aerosonde, as
theses are commonly used for collecting weather data. It is gasoline powered
which we felt was necessary as we are covering such a large area, and many of
the battery operated ones do not last very long. It has the ability to hold
sensor equipment as many of them come with different sensors, and it can last
about 38 hours in the field in one flight.
We
propose that a flight course would be pre-made to fly the vehicle back and
forth across lengths of the fields taking images along the way until the whole
area had been covered. You may want to carry this fieldwork out just before the
18-20 month growing period is over. Also, seeing as many of the regions where
pineapples are cultivated have cold very hot days but cold nights, it might be
best to fly the unmanned aerial vehicles at night, so as to keep the sensors
clod, but there would still be moisture content in the air. The data on
harvesting times would have to be done during the day, so that the hues of the
vegetation could be seen, and the camera does not require a special
temperature.
Scenario 2:
-
A mining company wants to get a better idea of
the volume they remove each week. They don’t have the money for LiDAR, but want
to engage in 3D analysis (Hint: look up point cloud)
We are presuming that since the company the company wanted
to use LiDar but couldn’t afford it, then the type of mining they are engaged
in is open pit and not underground. We came up with two possible ways for
monitoring the amount removed from the mine each week. One approach would be to
use digital imagery to detect the slag heaps, where measurements could be
carried out from the data collected to detect the volume of matter removed. The
other would be to use a cloud point method
where laser detectors are used to detect and later recreate an area, these
detectors would be flown over the actual mining pit in order to construct the
space, and then once this is done over time we could see how the size changes
and therefore the volume removed could be calculated.
For the first method the data collection should be fairly
quick so that type of unmanned air vehicle we would recommend would be perhaps
a slightly cheaper unmanned aerial vehicle can be used, so as to save money.
The flight time does not need to be that long so maybe even a battery operated
one would be sufficient, a quad copter may
be a good choice as it could fly straight up and over the slag heap and remain
fairly steady and balanced for the image taking.
This data collection would have to be carried out during
the day so that the heap could be seen, and the time of year would only be an
issue if the mine was located in a region that experiences winters with high
precipitation rates, that might obstruct the camera’s view. As the company
wants to know how much it removes each week, the image could be taken once a
week. Then using computer software like ArcMap,
the image could be downloaded a scale applied, and then volume calculations
could be made from measurements made on the computer.
3D scanning can be performed using a regular camera
attached to a UAV and entered into the appropriate modelling software. A steady
camera would be required, such as rotary wing copter with the ability to hover.
A rotary copter is most suitable for hard to reach locations, which may include
some mines. Using this technology an open pit mine can be visualized; from this
visualization it may be possible to determine the volume of the mine. Another
option may be to attach a specific 3D scanning camera to the UAV creating a
point cloud mesh, this option is very similar to LiDar; but would increase the
cost of the survey. Use of 3D sensor camera would yield a more detailed report
of the mine and would be very similar to overhead aerial LiDar and ground LiDar
surveys.
The data collection for the cloud point method will be
quite extensive, as the unmanned aerial vehicle that the sensor will be
attached to will have to cover all of the exposed mine, and may at some points
need to go down in to the pit. So definitely a gasoline powered on would be
appropriate and with a long flight time, so we would recommend a General Atomics GNAT. Also, as the data
needs to be recorded each week, the cost of the vehicle should probably be kept
fairly low.
Scenario 3:
- A military testing range is having
problems engaging in conducting its training exercises due to the presence of
desert tortoises. They currently spend millions of dollars doing ground based
surveys to find their burrows.
The Desert Tortoise is an endangered
species that lives in the Mojave and Sonoran desert of southern California,
Nevada, and Utah. They prefer semi-arid grasslands, desert washes, and sandy
canyon bottoms that are below 3,500ft elevation. They live in burrows that are
3-6ft deep. They are most active in the Spring and least active from November
through February, when they hibernate in burrows. Desert Tortoises depend upon
vegetation such as new cacti growth for food and water; they also consume
calcium-rich soil for digestion, and prefer to burrow in sandy loam soils
(ardisols) with varying amounts of gravel or clay. When rain is anticipated,
the tortoise will dig basins to collect the rainwater. Tortoises also prefer
south facing slopes. A recent study performed by the Department of Defense,
states that tortoises prefer to build burrows under a vegetation canopy near to
a desert wash. (Grandmaison 2010). All of these factors can be used to aid in
locating the tortoise habitats.
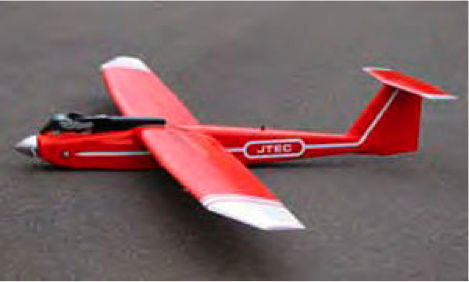
Figure 2: An Example of the Unmanned Air Vehicle that we feel would be appropriate to use in the data collection.
The use
of unmanned aerial systems (UAS) can aid surveyors in determining where Desert
Tortoise burrows are located. There are several options available for UAS,
including a fixed wing UAS, or rotary wing UAS. A fixed wing UAS is more
suitable for covering large areas, and can travel in a preplanned grid flight
path, as shown in figure 2 above. A rotary UAS is more versatile and can be used for small, but hard to
reach areas. A gas powered fixed wing UAS can have up to 10 hours of flight
time, allowing your organization to cover large areas in one survey. A
multi-spectral camera can be attached to this UAS to survey the area and
determine the soil type, vegetation and moisture of the ground below. Since
Desert Tortoises dig their burrows or basins the freshly dug soil may have a
different spectral signature than the ground; a simple remote sensing analysis
of the collected image would be required. The same multi-spectral sensor can be
used to create a false color image that will aid in visualizing areas of high
vegetation and moisture content, which tortoises prefer. The data collected from the fieldwork can be shown in figure 3 below.
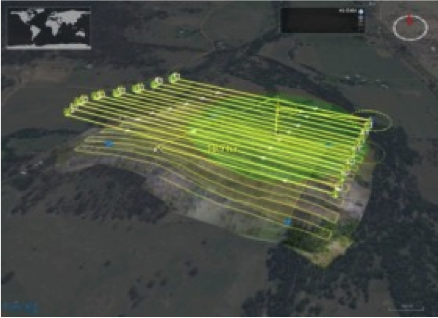
Figure 3: An example of the data collection model that would be created during the U.A.V. surveillance.
Other sensors could be used to create a
point cloud which would be used to create a digital elevation model through
photogrammetry. This model would be used to determine elevation and slope.
Combining the vegetation, elevation, slope and soil type information, a habitat
map could be created which highlights key areas that Desert Tortoises prefer
indicating areas also that would be better suited for training exercises. This
survey could be completed in early spring or during the months of November
through February.
Using a simple camera at low altitude
and analyzing the photography would be a low cost option to detecting the
burrows, other options such as using a multispectral camera and perhaps
creating a habitat map would be more expensive.
Scenario 4:
- A
power line company spends lots of money on a helicopter company monitoring and
fixing problems on their line. One of the biggest costs is the helicopter
having to fly up to these things just to see if there is a problem with the
tower. Another issue is the cost of just figuring how to get to the things from
the closest airport.
The first
question for this company would be "How much is 'lots of money?'"
While it was difficult to determine the cost to utilize a helicopter from
websites of companies that provided such services, those used for the purpose
of medical evacuation cost about $6500 per transport in 2010 (Wykes and
Sanford, 2013).
Assuming that a
medical transport would last approximately one- to three-hours, one could
estimate a cost of about $2170-$6500/per hour of specialized helicopter
services. Even so, using the lower end of this estimate, i.e. $2100, a power
company would have to spend about $19500 to use the helicopter services,
assuming a 9 hour workday.
The other major
issue with using a helicopter is that finding a nearby airport may be difficult
in cases where the power lines are located in remote areas. Flying or otherwise
transporting helicopters (e.g. via truck) to such remote areas would only add
to the cost of fuel and per-hour cost of the use of the helicopter.
Another problem
with using full-size helicopters to monitor power lines is that flights would
be weather-dependent. For instance, if the power lines are located in a region
plagued with inclement weather, how likely is it that a cancelled flight would
be able to resume ASAP once the weather improved? Probably not too likely
considering that the helicopter company would probably have other appointments
scheduled with other clients.
The most
effective solution to the problems presented by full-size helicopter inspection
of power lines mentioned above would be to employ an unmanned aerial vehicle to
inspect the power lines for damages. However, a fixed-wing UAS platform (FWP)
would not be recommended in the case of power line inspections due to: 1) the
vehicle's inability to hover and take the pictures/video necessary to asses
damage, if any and 2) the danger that power lines pose to the FWP should it
become entangled in them. The risk of entanglement in power lines also rules
out other, even cheaper, UAS platforms such as kites and balloons for the
inspection of power lines and towers.
The most
practical solution to the problems inherited by inspecting power lines and
towers would be to use rotary wing platforms (RWPs). Following are two examples of RWP systems on
opposite ends of the price spectrum.
The cheapest
resolution that would allow the utility company to effectively monitor its
lines and towers would be to deploy a relatively cheap RC RWP unit to the areas
where the towers are located. For instance, the Align RC 600 Nitro (fig. 4), which
comes as a kit and costs approximately $700, could be retrofitted with a
durable camera on its underside that would allow for the video inspection of
power lines and towers.
The
waterproof Ion-Air Pro 2 helmet camera (fig. 5), for instance, weighs only 4.6
ounces, is small in dimension (1.4 x 1.4 x 4.5 in.), and has 2.5 hours of
battery life. Costing roughly $250 apiece, several of these cameras could be
bought and attached to the Align throughout the workday as the battery fails in
each.
Although the
Align comes as a kit, it would likely be no problem for one of the power
company's maintenance workers to assemble it on site. Replacement parts for the
Align, such as rotary shafts, blades, and fuselages are also available on the
NitroPlanes web page (http://www.nitroplanes.com/15h-kx0160npc.html).
Furthermore,
the relatively cheap cost of the Align RWP would enable more than one copter to
be purchased, thus cutting down substantially on the time it takes to inspect
the towers and lines. For instance, ArcGIS could be used to establish
inspection zones and use a feature class layer to represent the towers. Each
Align operator could carry a GPS unit that was programed with the coordinates
of each tower and geographically "check off" each tower that was
inspected in their respective zone. Towers could also get identifying placards
installed on them so that their unique identifier could be synchronized to
specific coordinates in ArcGIS and the GPS device.
Mobility is
another pleasing aspect to the RWP solution. For example, operators could take
the small (approx. 7.1 pound) Align model with them in their company/all
terrain vehicles (ATVs) to the locations where the inspections would take
place. Once there, the Align could be deployed and the applicable data
collected.
Weather would
not affect Align missions as much as those conducted by companies with
full-sized copters because missions could simply be postponed until weather
permitted their re-initiation. Also, since all the Align operators would be
in-house (i.e. linemen trained to operate the RWP) rescheduling missions would
not be as daunting as compared to doing so for independent helicopter
companies. Furthermore, the low cost of the Align would ensure that if one of
the RWPs did happen to become lost or damaged, a replacement, although not
ideal, would be doable in terms of cost.
One downside
to this particular RWP model (i.e. the Align 600 Nitro) is that its 440 cc fuel tank only allows for
10 minutes of flight time, assuming no payload and ideal conditions. However,
the problem of limited flight time could be solved by simply replenishing the
fuel supply periodically throughout the workday. Also, the Nitromethane fuel
that this RWP uses is relatively cheap costing about $25 per gallon, according
to some internet sources
(http://www.ultimaterc.com/forums/showthread.php?t=176431) and would allow for
84 minutes of continuous flight time, assuming about 3700cc per gallon.

Figure 4: The Align RC
600 Nitro is a nitromethane powered, remotely controlled helicopter. With a
camera attachment, such as the Ion Air 2 in figure 2 below, this device would
be an ideal platform from which to monitor power lines and towers more cost
effectively than current full-sized helicopter services allow
(http://www.nitroplanes.com/15h-kx0160npc.html).
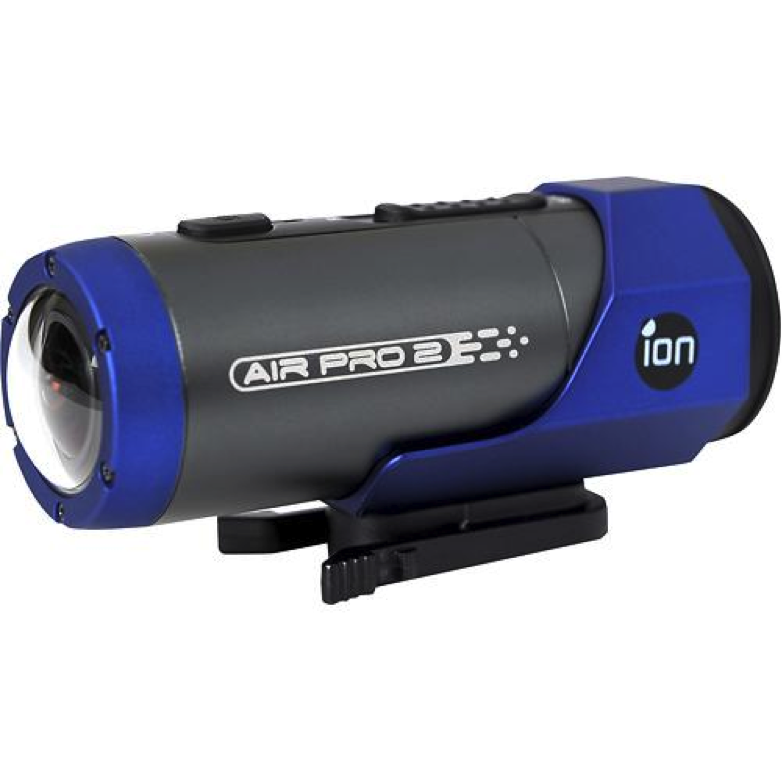
Figure 5: The cheap,
sturdy, waterproof Ion Air 2 helmet camera could be retrofitted to the
underside of the Align RC helicopter (or similar RWP system) in order to
visually inspect power lines and towers for damage. Multiple Ion Airs could be
purchased in order to compensate for the devices 2.5 battery life. (http://www.bestbuy.com/site/ion-air-pro-2-wi-fi-hd-camcorder-blue-black/2174008.p?id=1219070712053&skuId=2174008&ref=06&loc=01&ci_src=14110944&ci_sku=2174008&extensionType={adtype}:{network}&s_kwcid=PTC!pla!{keyword}!{matchtype}!{adwords_producttargetid}!{network}!{ifmobile:M}!{creative}&kpid=2174008&k_clickid=02b4ced1-feed-2e49-2a09-00003036eaf6#tab=overview).
When fitted
with a fuel engine, the Avenger by Leptron (fig. 6) gets about 2 hours of
flight time. The biggest draw-back for the Avenger is its price tag which
equates to about $100,000 apiece (Joyce). The reason for the high cost of the
Avenger compared to the Align 600 is because, in addition to increased flight
time; durability; and performance (i.e. its ability to operate in 40 mph
winds), the avenger is much more versatile in terms of operability. For
instance, the Avenger can be manually controlled by an operator through either
a laptop Windows interface, or via a controller.
Also, a more
sophisticated RWP such as the Avenger can also be flown by using GPS way-points
to guide its flight path (autopilot). This option would be useful as the RWP
could be flown to previously geocoded towers before the operator switches over
to RC mode in order to perform a more precise inspection of the tower. Once
each geocoded tower was inspected, it could be "checked off" the list
if the inspection was a part of routine, preventative maintenance (PM).
Also, the
ability of the Avenger to switch between RC and auto pilot mode is good since
remotely located power lines might be miles from the road. In this case, the
11-pound Avenger could be transported via ATV or company vehicle to the area of
interest and operated by remote control in order to inspect power lines and
towers.
Another
attractive aspect of the Avenger is that Leptron sells specialty cameras that
can be fitted onto the Avenger. These turret-mounted cameras (fig. 7) have
geo-locator capabilities, are stabilized, and can be operated from the
Avenger's remote control as opposed to commercially available cameras that
could be mounted to the avenger in order to cut costs.
One problem
that the power company may have with the Avenger is that its price may limit
the utility company to only one unit, and thus less area covered over a given
time as compared to multiple cheaper units being operated simultaneously, as
given in the Align example.

Figure 6: Image of the
Avenger by Leptron in flight. Although
far more expensive than the Align RWP, the durable Avenger integrates all its
geospatial technology, such as geocoding, geo-locating, and GPS way-points,
into one unit so that data relating to power line and tower inspection can be
easily classified
(http://www.leptron.com/corporate/products/avenger/specs.php).

Figure 7: Some of examples of the more sophisticated, turret-mounted,
remotely operated cameras that can be used fitted onto the Avenger RWP system
(https://www.leptron.com/corporate/products/avenger/camera.php).
While the Align
and Avenger RWP options above both solve the fiscal problems associated with of
utility line inspection via full-sized helicopters, each does so in a different
way. For instance, while the Align option is much cheaper than the Avenger
option, the Align would be much more cumbersome in terms of operation,
mobility, flight time, convenience and data accuracy. That being said, all the
problems associated with the Align option could be solved, but it would require
unconventional synchronization of many different systems such as cameras, GIS,
GPS, and flight operation; whereas with the Avenger option, all these systems
would come already integrated with one another.
However, with
the convenience of the integrated flight, GPS, and GIS systems, as well as
other luxuries such as improved quality and performance in addition to
high-tech camera systems, the Avenger by Leptron comes at a price. While the
price of the Avenger may limit the utility company's ability to purchase more
than one unit, the overall price of the system would still save the company
money in the long run with the unit paying for itself after five or so uses
(assuming $19500/nine-hour day for a conventional helicopter service).
Scenario 5:


Scenario 5:
- An oil
pipeline running through the Niger River delta is showing some signs of
leaking. This is impacting both agriculture and loss of revenue to the company.
According
to the scenario above, the main problem is that the oil company does not know
where the source of the leak is located on the Niger River Delta (fig. 8).
Following is one method in which the leak could be determined in a cost
effective and efficient manner from an unmanned aerial platform in order to
prevent further damage to the delta environment as well as to the oil company's
revenue.
The proposed
system will not only make locating the leak easy, but will also allow for the
data obtained from the proposed monitoring system to be easily synchronized
with geospatial systems. For instance, taking advantage of such geospatial
programs such as GPS and ArcGIS in order to locate the leaky pipeline.
However, it should
be noted that the following idea involving the use of tethered balloons to
locate the source of the leaking oil on the Niger River are based solely upon
the small amount of information provided by the oil company thus far. It may be
determined that other, more effective unmanned aerial systems may be better
suited to locate the oil leak after the following important questions are
answered by the oil company:
1) How was the leak discovered?
2) What, if any, is the estimated cost of the leak in terms
of its impact on the delta region and in terms of revenue lost to the oil
company
3) What is the estimated area of interest (AOI) of the leak
in both terms of size and geographic location?
4) What measures, if any, have already been undertaken to locate
and stop the leak by the oil company
5) What, if any, has been the involvement of Nigerian
government regarding the matter of the contamination of the Niger River delta
6) Has the oil company consulted with other authorities,
such as environmental consulting firms, on the matter of contamination due to
oil leaking into the Niger River delta?
Figure 8: The general area of interest in the Niger River delta on the west
coast of the African continent. More information from the company whose oil
pipeline is leaking will be needed in order to pinpoint the exact AOI in this
region
The first
problem is that the location of the leaking pipe is unknown. In this case, an
aerial surveillance system consisting of near infrared (NIR) cameras suspended
from tethered balloons will be placed at various, predetermined locations on
banks of the Niger River in order to take aerial photographs of the river's
surface water. NIR cameras attached to each balloon platform would be
periodically retrieved so that the spectral data collected by them could be computationally
analyzed. From this spectral data it could then be determined whether or not a
specific section of the Niger River corresponding to a particular balloon was
contaminated with oil. Once a non-contaminated portion of the river was found,
ground crews could then search between the balloon that exhibited no signs of
an oil leak and the nearest balloon that did downstream of it; this is the area
where the leak should be.
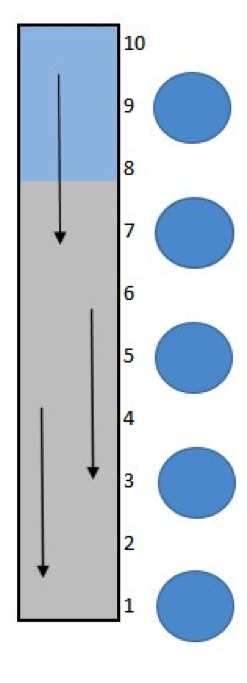
In order to
illustrate this procedure more clearly, figure 2 shows a series of balloons
along the banks of a model river; numbers on the right-hand side of the image
correspond to arbitrarily determined river-miles. Blue and grey shading
corresponds to water that is uncontaminated and contaminated by oil,
respectively, while arrows indicate the direction of water flow. So, for
example, if the sensor on the balloon at river-mile 9 detects no contamination,
but the balloon at river mile 7 does, then it could be reasoned that the leak
in the pipeline is between river-miles 7 and 9 and ground crews could be
dispatched to this area in an attempt to locate the leak.
Figure 9:
illustrates how the source of oil contamination could be determined using a
system of tethered balloons to monitor contamination in the AOI. Balloons in
this diagram correspond to odd-numbered river miles. Each balloon will take a
series of aerial photographs in NIR to locate surficial oil contamination on
the river (grey areas). Once an area the river is found to be free of
contamination (blue) using aerial surveillance, ground crews need only to
search between that balloon and the nearest one exhibiting contamination
downstream of it to find the source of the leak; in this example, between river
miles 7 and 9.
In order to
determine whether or not the water in the Niger River is contaminated, the
correct sensors must be attached to the tethered balloons. Figure 10 shows some
of the spectra associated with oil slicks on water, as determined by the USGS
during the 2010 Deepwater Horizon (DWH) oil spill in the Gulf of Mexico.
While the DWH
spill was likely more massive than the one being examined in this article, the
USGS found that when viewed in infrared
wavelengths, different thicknesses of oil slicks displayed different spectral
signatures. Computational analysis could then be performed on the images
collected by the sensors to determine whether or not the portion of the river corresponding
to that particular sensor was contaminated or not.
Using the
spectral information provided by the USGS, NIR cameras would likely be the best
photographic method for determining whether or not the surface waters on the
Niger River are contaminated with oil or not.
Figure 11
shows an example of a near-infrared camera, from Edmund Optics, that could be
suspended from a balloon platform in order to locate surficial oil
contamination on the Niger River. While far from cheap at nearly $2000 apiece,
this price likely pales in comparison to what the oil company is losing in
revenue and mounting cleanup cost.
Figure 10: An example of the spectra measured by the USGS during the Deepwater Horizon oil
spill in 2010. It was found that when using NIR sensors, thin layers of oil
could be spotted on the surface of the water; i.e. those less than 0.5 mm thick
(blue line).
Figure 11: One of the cheaper NIR cameras offered by Edmund Optics. This device, which
weighs about 90 g and costs about $2000, could be suspended from the tethered
balloon platforms in order to detect thin layers of surficial oil contamination
on the Niger River delta
According
to precipitation graphs for Lagos, Nigeria, which is approximately 200-300
miles away from the AOI on the Atlantic coast, weather should not inhibit the
deployment of balloons except, maybe, in the months of May, June, and July,
when rainfall exceeds 200 mm per month (fig. 5). However, if inclement weather
were to occur on a day when the balloons were scheduled to collect data, their
deployment could be easily rescheduled until a more meteorologically favorable
day.
The cost of
the balloons themselves is very minimal when compared to overall cost of the
spill in terms of ecological damage and revenue lost. Offered by Balloons
Direct, figure 6 shows an example of a weather balloon that could be used in
this project. Each balloon costs about $35 and has a payload capacity of 3
pounds, which is more than enough to lift the 90 gram infrared sensor mentioned
above in figure 4.
In order to
deter theft of the expensive NIR cameras, it would be beneficial to outfit each
camera with a harness system that was easy to detach from its balloon
monitoring platform. This detachable harness system would also be beneficial as
the NIR cameras would need to be removed periodically anyway in order to
download their images onto a computer for spectral analysis.
Balloons could
be tethered to the ground using a rope or cable attached to either a hand
operated or motorized winch. However, the balloons would likely not be very
high off the ground (<20ft.) and a more expensive, motorized winch system
would be more of a luxury than a necessity.
Figure 12: The average precipitation for each month in Lagos, Nigeria, located
approximately 200-300 miles up the Atlantic coast from the Niger River delta.
Based on rainfall averages projected here, the only problematic months for a
balloon launch somewhere in the Niger River delta would be May, June, and July
of any given year; that is, when the precipitation is greater than 200 mm per
each month
(http://www.eldoradocountyweather.com/climate/africa/nigeria/Lagos.html).
FIGURE 13: The cost-effective ($35) "Cloud Buster" weather balloon offered
by balloons direct. Its 3-pound payload capacity would be more than adequate to
lift the 90 g NIR camera shown in figure 4
(http://www.balloonsdirect.com/products/55-foot-cloudbuster-weather-balloon-orange).
While
locating the oil leak on the Niger River Delta is no easy task, regardless of
what method is used to determine its source, the use of tethered balloons
outfitted with NIR-sensors would provide an efficient and cost effective manner
of doing so given the information that was made available by the oil company
thus far.
Once the
questions presented in the beginning of the article are answered, other, more
effective measures may be recommended based on that information. For instance,
if the size of the leak is large enough, the Nigerian government or an
environmental consulting firm may be able to offer further assistance to the
oil company in addition to our services.
Sources:
AAI. 2014. Unmanned Systems. AAI Corporation. Available at: https://www.aaicorp.com/products/unmanned-systems <Accessed on: Friday 14th February 2014>
Clark, R.N., Swayze, G.A., et. al, 2010 , A method for
qualitative mapping of thick oil spills using imaging spectroscopy: http://pubs.usgs.gov/of/2010/1101/ (accessed February
2014).
Dole. Unknown. Pineapple Cultivation. Dole-Plantation. Available at: http://www.dole-plantation.com/Pineapple-Cultivation <Accessed on: Friday 14th February 2014>
El Dorado Weather, 2014, Lagos, nigeria, africa average
annual temperatures:
http://www.eldoradocountyweather.com/climate/africa/nigeria/Lagos.html
(accessed February
Grandmaison, David D., 2010.
Landscape-Level Habitat Associations and. (n.d.). Department of Defense Legacy
Program. Retrieved February 16, 2014, from
http://www.denix.osd.mil/nr/upload/08-385-Technical-Report-Landscape-Level-Habitat-Associations-and-Phylogenetics-of-Desert-Tortoises.pdf
Sanford, J., and Wykes, S, 2013, Study examines
cost-effectiveness of helicopter transport of trauma victims:
http://med.stanford.edu/ism/2013/april/helicopter.html (accessed February
2014).
Unknown. Unknown. UAV: fixed wing or rotary?. (n.d.).
sUAS News. Retrieved February 16, 2014, from http://www.suasnews.com/2013/09/25214/uav-fixed-wing-or-rotary/
Unknown. Unknown. Introduction to Thermal Infrared Remote Sensing.University of California - Santa Barbra, Department of Geography. Available at: http://www.geog.ucsb.edu/~jeff/115a/remote_sensing/thermal/thermalirinfo.html <Accessed On: Friday 14th February 2013>
No comments:
Post a Comment